Driving investor engagement through a personalised dashboard experience
The app was becoming an investment companion, but its dashboard was still a static wall of data. I led the redesign that turned it from passive tracking into active decisions.
- Role: Design lead
- Collaboration: 12 teams, 31 people
- Platform: Mobile app
Live on the App Store. Download it and try the dashboard.
- +127%
Engagement
On the dashboard - +64%
Repeat visits
People coming back - +89%
Action clicks
Insight → action - 4.8★
App rating
From investors
The product was evolving. The dashboard wasn't.
It showed information, but it didn't help anyone understand it or act on it. Three business goals set the bar.
Increase engagement
Make the dashboard a frequently visited, high-value touchpoint.
Improve investment actions
Move people from insight to action with the key actions close at hand.
Strengthen retention
Build a long-term relationship through a personal, meaningful experience.
The baseline: engaged on the surface, not acting
- 43saverage session time
- 12%feature interaction
- 3.2%action rate
- 2.1×return frequency
People opened the dashboard, but to do anything they had to navigate away, and everyone saw the same screen, so little of it felt relevant.
Three problems, prioritised with the PM
From Axis MF's research archives and an analysis of 10+ competitors. Awareness went first: it had the biggest business impact.
Understanding
Users saw data but couldn't interpret it
Multiple metrics with no hierarchy made it hard to tell how a portfolio was actually doing.
Direction
No clear next step
Without guidance, people missed chances to invest more, rebalance or explore.
Retention
Engagement dropped after investing
Once the investment was made, there was little reason to come back.
Key insight
Users don't want more data. They want clarity, and direction to act.
Leading 12 teams and 31 people
Not everyone needed the same seat at the table. Clear levels of involvement kept decisions moving.
Engaged: co-create
The teams closest to the problem worked inside the design process through co-creation sessions and brainstorms, with a safe space to bring ideas in early.
- Product
- Design
- Engineering
- Research
Tap a ring. 12 teams and 31 people, each with a clear level of involvement.
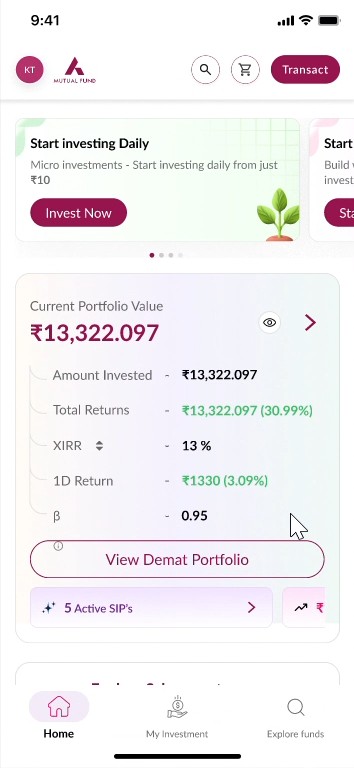
What the old dashboard got wrong, and what replaced it
Cluttered home screen
“Invest now” fought the portfolio card, and a floating “Start SIP” confused people.
A clear top-down hierarchy
Greeting, then one primary action. No competing calls to action.
Sections stacked at random
Portfolio mixed in with schemes and promotions, with no grouping logic.
A modular structure
Quick-action blocks for frequent tasks; advanced features in collapsible insights.
An overloaded portfolio card
XIRR, returns, percentages and tags all at once.
A clean portfolio card
Grouped figures with room to breathe; detail on demand in an accordion.
No guided flow
Only Home and Explore Funds, and more scrolling to find your own investments.
Navigation that guides
Home · My Investment · Explore, with your Relationship Manager one tap away.
Key Decisions
Re-architect the information hierarchy
If every number shouts, none is heard. Portfolio value and returns come first; XIRR and the rest wait inside an accordion.
One focal point, not twelveAdd a personalisation layer
The same screen for everyone was why it felt irrelevant. Nudges based on each portfolio (invest more, rebalance, explore) made it actionable.
Informational → actionablePut actions inside the dashboard
Every screen between an insight and the action is a chance to lose the intent. Investing, switching and exploring now start right there.
Steps to act: 4–5 → 1–2Watch the whole journey
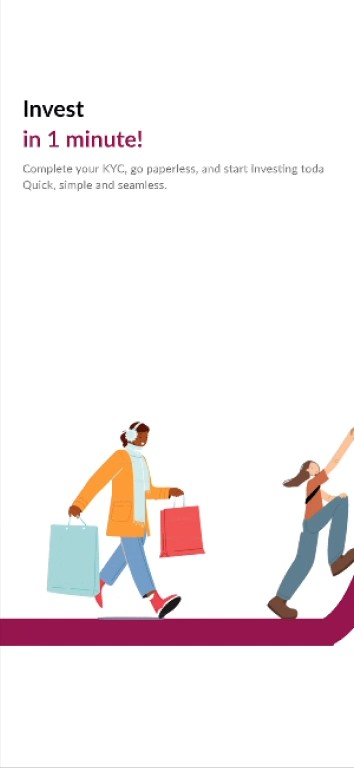
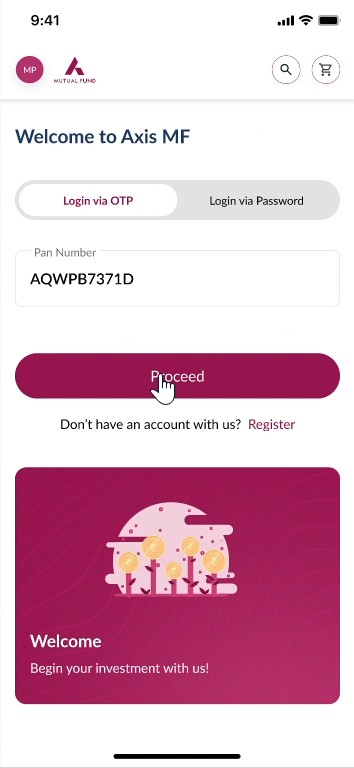
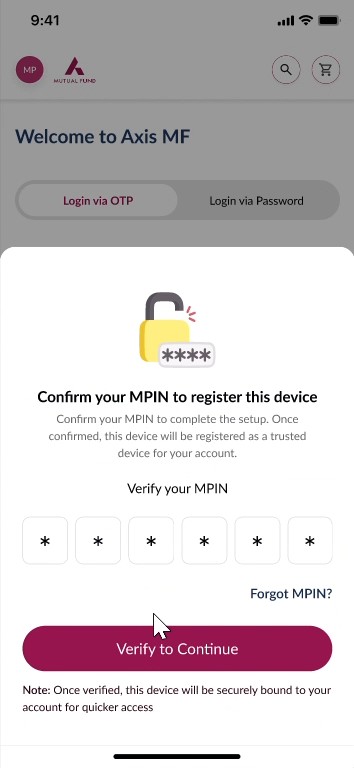
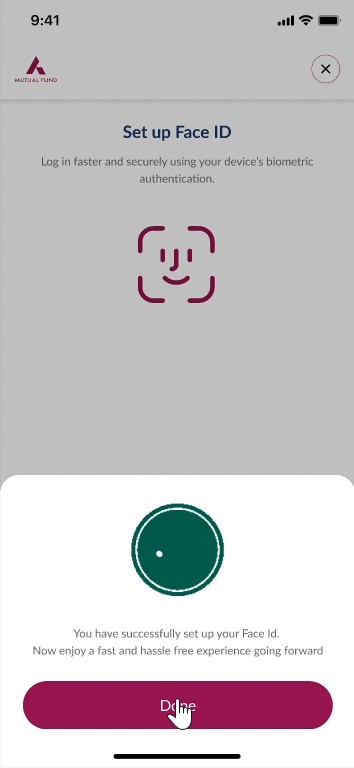
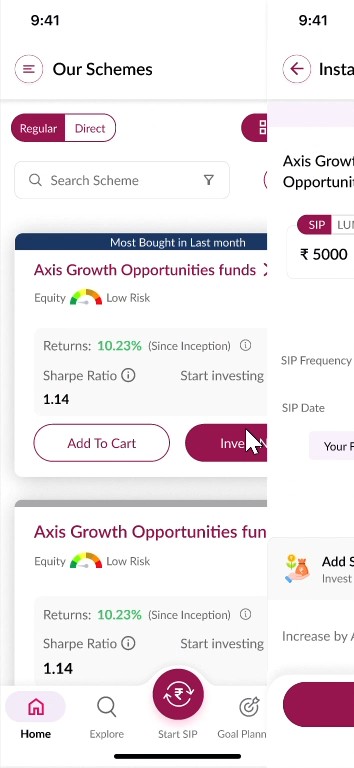
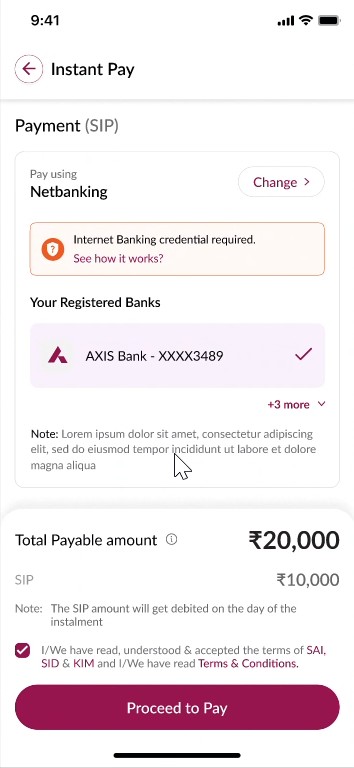
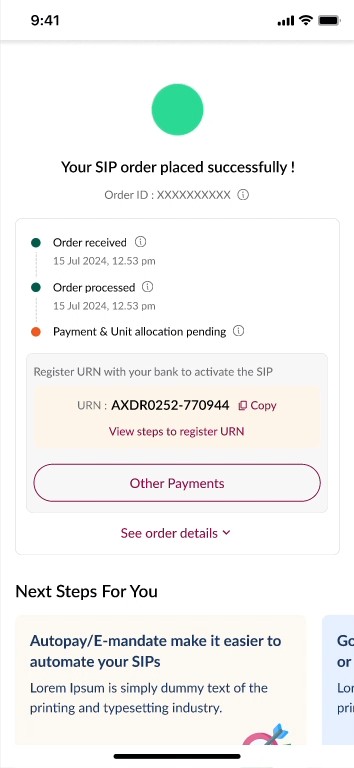
A real recording of the shipped app, from first launch to a confirmed SIP. Tap a step to jump to it.
Screen by screen
Constraints we designed within
Some data couldn't be removed
Compliance required certain financial figures to stay visible.
Tradeoff: Simplicity vs disclosure
Required figures stay on the card, but behind a clear hierarchy and an accordion, so they're present without competing with the answer people came for.
Legacy backend limitations
Not every insight could be computed in real time.
Tradeoff: Ideal insights vs what the data supports
Nudges were scoped to signals the backend could already provide reliably, so personalisation shipped now instead of waiting on new infrastructure.
Many teams, one home screen
Twelve teams all had reasons to want space on the dashboard.
Tradeoff: Every request vs a calm screen
Modular sections with a fixed order: portfolio first, then personal nudges, then explore. New asks slot into a module instead of the top of the screen.
Outcome
- +127%
Engagement
On the dashboard - +64%
Repeat visits
People coming back - +89%
Action clicks
Insight → action - 4.8★
App rating
From investors
From passive tracking to active decision-making. Improving a core journey turned out to be one of the most effective ways to validate, and accelerate, the broader product direction.
What I learned
Clarity beats feature depth
Engagement grew from making existing information legible, not from adding more of it.
Personalisation raises perceived value
The same data, framed around your own portfolio, felt like a different product.
Less cognitive load, faster decisions
Every number removed from the first glance made the next decision quicker.
Try the dashboard on your phone
Download Axis Mutual Fund, sign in with your PAN, and see the dashboard this case study describes.